

|
SUMMARY:
"I'd love to see this chart republished and segmented by industry." |
by Daniel Burstein, Director of Editorial Content
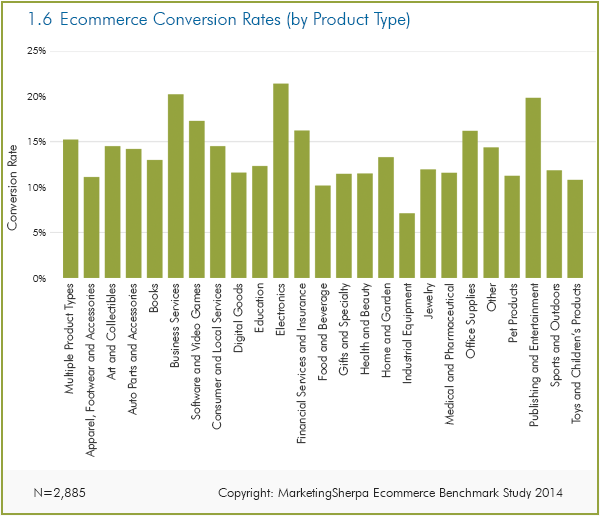
We are currently fielding our latest marketer survey, so we thought this would be the perfect time to share published data from a previous survey — the MarketingSherpa Ecommerce Benchmark Study. Below is one of the most popular charts from the study, where we explore ecommerce conversion rates broken down by product type based on responses from 2,885 marketers.
In the MarketingSherpa Ecommerce Benchmark Study survey, we asked:
Q. What is your average conversion rate for ecommerce sales (%)?
We also asked:
Q. Which product categories does your organization sell through ecommerce? (Select all that apply)
Below is the chart of responses from 2,885 marketers to these questions. Keep reading for an analysis of the data, and feel free to comment with your own analysis as well.
Click here to see a printable version of this chart
What is the best way to compete with the mega retailers like Amazon and Walmart?
Some business strategists have suggested going niche — focus very narrowly on a specific product type and better serve that audience.
While that may work in some instances, the above data suggests there could be flaws in that strategy. We found that the average conversion rate for companies selling only one product was 16.3%, while those selling multiple product categories had a higher conversion rate at 17.2%.
This wasn't the case for all product categories, so there could still be opportunities to have a successful niche-focused value proposition — if you choose the product category wisely.
These six product categories had average conversion rates exceeding the multiple category group:
It should be noted that three product categories had insufficient responses for analysis and were not included in the above chart.
You should not view the above conversion rate data in a vacuum. To see the data in context, it helps to download the free MarketingSherpa Ecommerce Benchmark Study, made possible by a research grant from Magento, an eBay company.
You must understand that the above data shows averages, which have been skewed up due to some responses that were much higher than average. You can gain an understanding of the distribution of conversion rate responses by reading previous MarketingSherpa Charts of the Week:
The entire point of tracking conversion rates should be to identify opportunities for improvement.
While this Chart of the Week focuses on conversion rates by product type, you will get the most value from your conversion rate data if you segment it in a way that illuminates these opportunities.
This will vary by company, but here are a few examples to get you thinking on which view of conversion rates will help you improve performance.
By channel
Which channels overperform and underperform the investment your company makes in them?
By stage in the funnel
Where in the buyer's journey are customers dropping off and how can you increase conversion in that stage?
By customer segment
How can you better focus on the needs of specific customer segments to increase conversion? Which customer segments are you currently targeting aren't really ideal prospects?
Stop investing resources in these areas, and focus on the customers you can best serve.
As one Benchmark Study survey respondent replied:
"We segment our customer base on the basis of end use of the product. We have several product categories, and hence, market products specific to their end-use customers."
In response to a reader question, Dr. Diana Sindicich, Director of Market Intelligence, MECLABS, explains the above data.
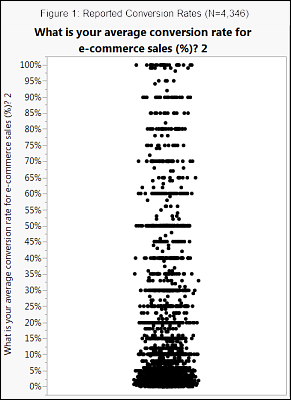
In this survey, we had some respondents list conversion rates all the way across the spectrum from 0-100% (Figure 1). Although it is hard to believe that a site would have 100% conversion, it is theoretically possible if the only people who arrived at the site were those who already wanted to convert. We did not allow respondents to select impossible responses (like 125% or text), restricting responses to numbers between 0% and 100%. The bulk of responses were below 10%, with a median of 5%.
Looking at a stem and leaf plot, we see that the mean was very low, as would be expected (Figure 2). The 363 responses above 47% were outliers (N=4,346).

The second point brought up in the reader's question was to provide statistics for those companies not engaging in optimization testing, which is an interesting idea. One of our questions did address what percent of marketing budget was spent on conversion optimization, so we can split out that group (Figure 3).


Download the MarketingSherpa Customer Satisfaction Research Study
Quick Guide to Conversion Rate Optimization
Subscribe to MarketingSherpa Chart of the Week
Get the first look at consumer purchase preference data — Take 15 minutes to complete the 2015 MarketingSherpa Practices Survey, and get a free pre-release copy of the August 2015 MarketingSherpa Consumer Purchase Preference Survey plus a chance to win a free, three-day ticket to MarketingSherpa Summit 2016 in Las Vegas or an iPad Air 2. The deadline is September 28.
MarketingSherpa Ecommerce Benchmark Study — Made possible by a research grant from Magento, an eBay company
Ecommerce Research Chart: Acquisition cost per customer
Ecommerce Research Chart: Does customer responsiveness correlate with success?
Ecommerce Research Chart: How can companies increase conversion rates? [Video]

Join our thousands of weekly case study readers.
Enter your email below to receive MarketingSherpa news, updates, and promotions:
Note: Already a subscriber? Want to add a subscription?
Click Here to Manage Subscriptions
Get Better Business Results With a Skillfully Applied Customer-first Marketing Strategy

The customer-first approach of MarketingSherpa’s agency services can help you build the most effective strategy to serve customers and improve results, and then implement it across every customer touchpoint.
Get More Info >MECLABS AI

Get headlines, value prop, competitive analysis, and more.
Use the AI for FREE (for now) >Marketer Vs Machine

Marketer Vs Machine: We need to train the marketer to train the machine.
Watch Now >Live, Interactive Event

Join Flint McGlaughlin for Design Your Offer on May 22nd at 1 pm ET. You’ll learn proven strategies that drive real business results.
Get Your Scholarship >Free Marketing Course

Become a Marketer-Philosopher: Create and optimize high-converting webpages (with this free online marketing course)
See Course >Project and Ideas Pitch Template

A free template to help you win approval for your proposed projects and campaigns
Get the Template >Six Quick CTA checklists

These CTA checklists are specifically designed for your team — something practical to hold up against your CTAs to help the time-pressed marketer quickly consider the customer psychology of your “asks” and how you can improve them.
Get the Checklists >Infographic: How to Create a Model of Your Customer’s Mind

You need a repeatable methodology focused on building your organization’s customer wisdom throughout your campaigns and websites. This infographic can get you started.
Get the Infographic >Infographic: 21 Psychological Elements that Power Effective Web Design

To build an effective page from scratch, you need to begin with the psychology of your customer. This infographic can get you started.
Get the Infographic >Receive the latest case studies and data on email, lead gen, and social media along with MarketingSherpa updates and promotions.
